This tutorial is to write a very simple audio visualizer using PyGame, PyAudio, and Numpy. The visualization uses the frequency domain of some input sound, and display a bar graph of the frequency domain as the audio plays. The audio source is the computer line-in or microphone.
Background Information
The frequency domain can be thought of as all sine waves that when added together produce the original wave. However this only applies in the continuous world. If we use move to the discrete world it’s only an approximation, but if we take infinite samples it will match the original. The transformation to the frequency domain is called the Fourier transform (awesome video by 3blue1brown highly recommended).
As 3blue1brown explains the Fourier transform maps a signal on to a circle. This is done with complex numbers because the real part maps to x-axis and the imaginary to the y-axis. We can then do all kinds of interesting transformations with this number.
You can think of it as the following:
\[F(t) = \sum_k^n x_k sin(2{\pi}kt)\]Where \(x_k\) is the \(k^{th}\) frequency in the original signal.
Project Setup
- Install python for your operating system. Find instructions to do this. There are way too many tutorials out there, and I don’t need to write another one.
- Then install the following packages via pip.
- You can do this in a virtualenv if desired.
pip install pyaudio pygame numpyIf running Linux you might have some issues if PortAudio is not installed in your environment. Please see this AskUbuntu answer. The linux sound ecosystem is a little bit messy.
The Code
It’s probably most helpful if you type it into a text editor yourself to pause and ponder about it. It should be noted that some python IDE’s don’t pick up all of the methods in PyGame, just ignore the warnings it will still work.
The first part is to import the required modules and perform some basic setup of PyGame.
from math import sqrt
import numpy as np
import pygame
import pyaudio

# Tell pygame to startup
pygame.init()
Next setup some parameters about the audio data. Such as the sample rate and how often to read in data. Shorts are used here because that’s what a lot of code uses, and it provides more than enough range for our purposes. Shorts are 16 bit numbers, and can range from -32768 to 32676.
# Cd quality audio is typically 44.1kHz.
RATE = 44100
# Update the screen 60 times per second
CHUNKS_PER_SECOND = 60
# The size of each chunk
CHUNK = int(1/CHUNKS_PER_SECOND) * RATE
# We want 16 bit samples.
FORMAT = pyaudio.paInt16

# next we open up our stream from PyAudio
p = pyaudio.PyAudio()

stream = p.open(format=FORMAT,
    channels=1,
    rate=RATE,
    input=True,
    frames_per_buffer=CHUNK)
The visualization to be the same size as the CHUNK, and it’s super
easy to just used pixel based measurements here. So make the display x
axis the same size as our CHUNK. ALso pick out a decent height for our
y-axis, something that meshes well with your display size.
SCREEN_HEIGHT = 600
screen = pygame.display.set_mode((CHUNK, SCREEN_HEIGHT))
The next step is to create a standard pygame loop.
done = False
while not done:
    # process events
    for event in pygame.event.get():
        if event.type == pygame.QUIT:
            done = True
            break

    # Process data

    # Clear screen to black
    screen.fill((0, 0, 0))

    # execute our drawing commands here

    # Flip the buffer
    pygame.display.flip()
From here, the loop parts will be broken down. Let’s start by reading a
chunk in during the process data phase. Then the stream object is
requested to give us our samples. It returns a bytes like object. We use
numpy to convert it into an array. Numpy’s frombuffer method lets us
take a bytes like object and interpret it as we need to. Here the bytes
should be interpreted as a view as a chunk of 16 bit ints.
buffer = stream.read(CHUNK)
waveform = np.frombuffer(buffer, dtype=np.int16)
These could be nested.
The next step is to apply the fourier transform to the wave form to transform into the frequency domain. This returns a numpy array of complex valued numbers. Complex numbers can be interpreted in many ways.
fft_complex = np.fft.fft(waveform, n=CHUNK)This is all the data processing required. Moving onto the visualization phase. Do you want to display the real and imaginary parts together? Do you want to focus on distance or go back to the real part only?
The visualization will start with a simple histogram and normalizing the distance of the complex on to the y=domain. The mapping formula is based on a simplified form from arduino, or \({mapped} = {value} \times \frac{output max}{input max}\).
# Use a pretty green for our histogram
color = (0, 128, 0)
# these operations can be factored out.
# sqrt does not need to be computed for every distance
max_val = sqrt(max(v.real * v.real + v.imag * v.imag for v in fft_complex))
# factor out the scale multiply.
scale_value = SCREEN_HEIGHT / max_val
# for index and value in the frequencies
for i,v in enumerate(fft_complex):
# calculate the distance using the ecludian distance measure.
dist = sqrt(v.real * v.real + v.imag * v.imag)
mapped_dist = dist * scale_value
# You'll note that we have to start high. This is because on screen
# the y axis is mirrored.
pygame.draw.line(screen, color, (i, SCREEN_HEIGHT), (i,
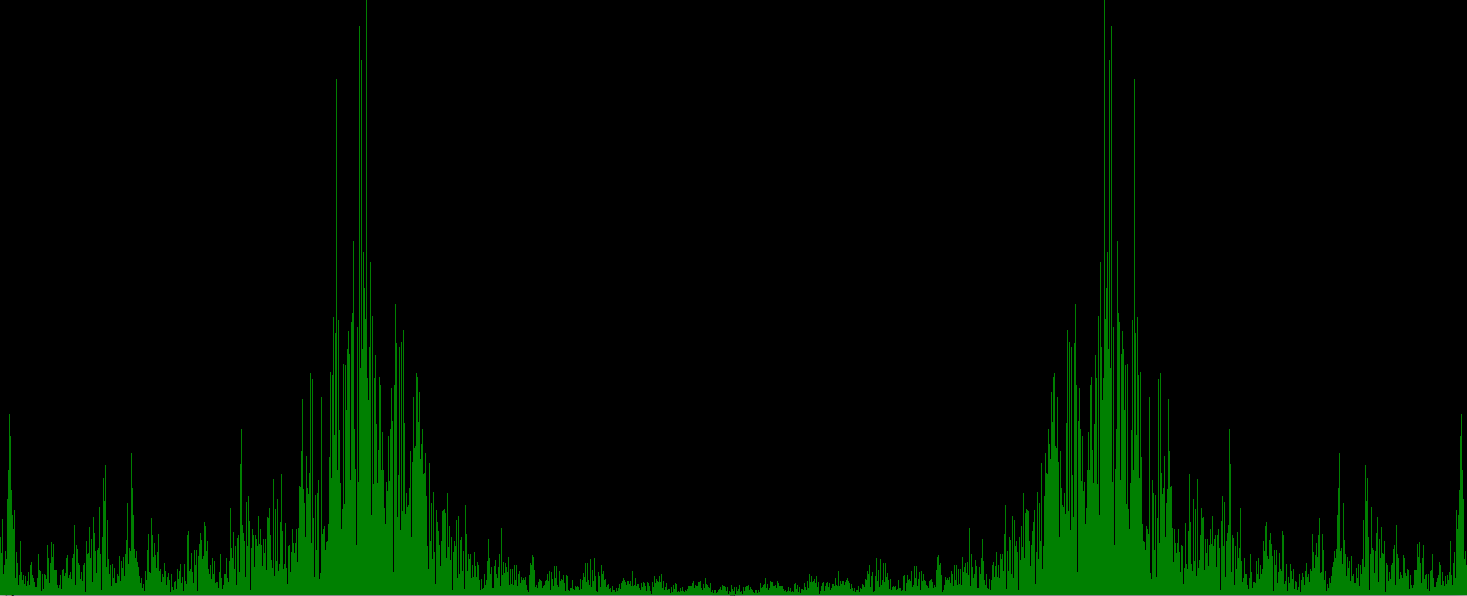
SCREEN_HEIGHT - mapped_dist))At this point when the program is ran the histogram should be displayed. The below is an example where I hummed.
You can download the completed source code from here, but I still
recommend you type it up yourself. Run it like python py_fft_viz.py.
Where to go from here
From here the world is yours to explore, but I leave you with a couple of options on how to expand this.
- Come up with your own visualization!
- You might want to start keeping a history and fading out previous values.
- Maybe you want to project some symmetry.
- Treat the complex value as a vector.
- Plot the complex and real value as a stacked value.
- Use the distance to project into some color space.
- Change some values.
- What happens when you change the
CHUNKS_PER_SECONDorRATEparameters? - What if you use a different distance metric?
- What happens when you change the
The world is your oyster from here. Use this knowledge to make some cool stuff. If you make something awesome, please share it with me at hschmale16@gmail.com