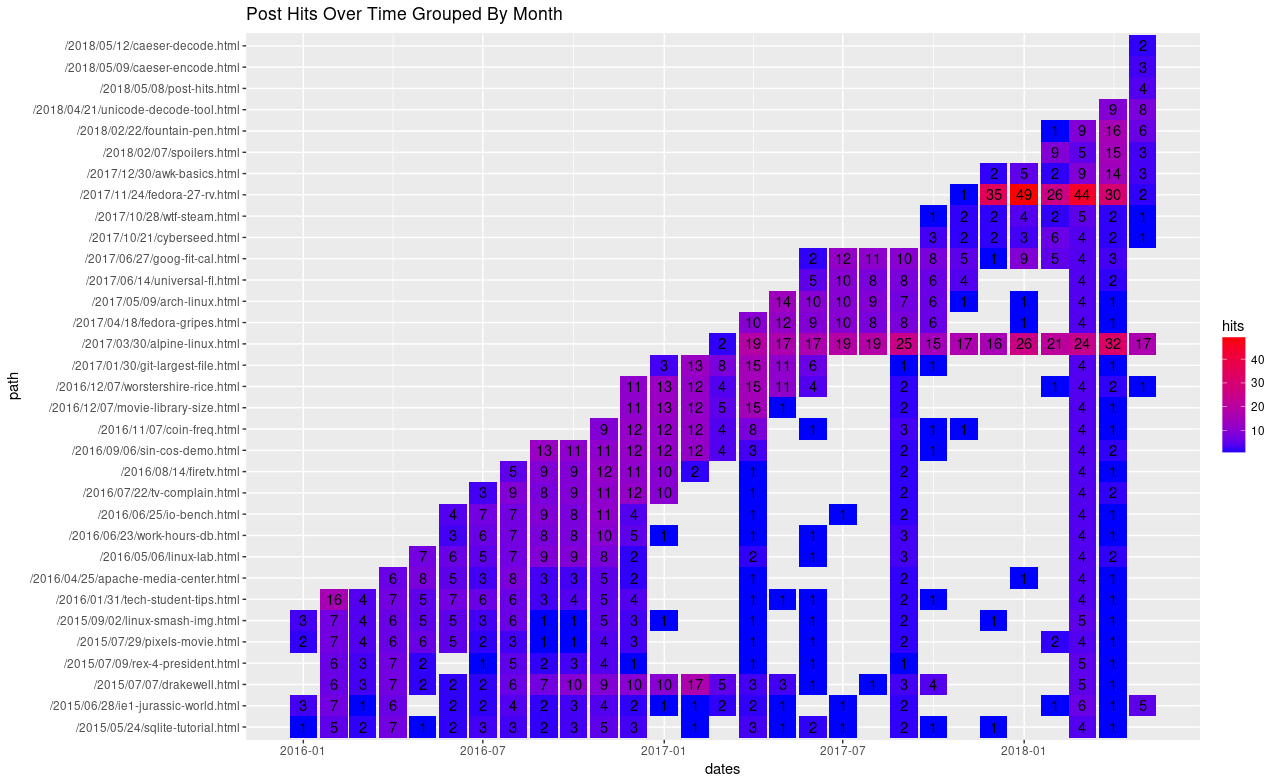
Just sharing a data visualization of my most popular blog posts.
I made this with ggplot2 and R by processing my apache log files with python. You can get the source code at the github.
You just need to place your log files in a directory called logs, and call ./run.sh.
The plots will be generated in Rplots.pdf in the current working directory.
EDIT: I just realized that the log_count_views.py script did not
properly exclude bots from the view results. I have updated the image
with a replaced image showing the latest results, without bots included.